
I’ve nearly finished Webscavator, my visualisation application for the forensic analysis of user web history! The next series of blog posts will describe some of the visualisations I’ve used and how to code them. They are all written in server-side Python and client-side Javascript using jQuery. First on the list are heatmaps. These visualisations show the data using colour. For example low values go blue and higher values go red to visualise a temperature scale. A couple of examples can be found at heatmapapi.com, Google Visualization API and GraphUp. I found the Google Visualization API too limiting to work with for this particular visualisation, and GraphUp is not free or open source, so I made my own, described below.
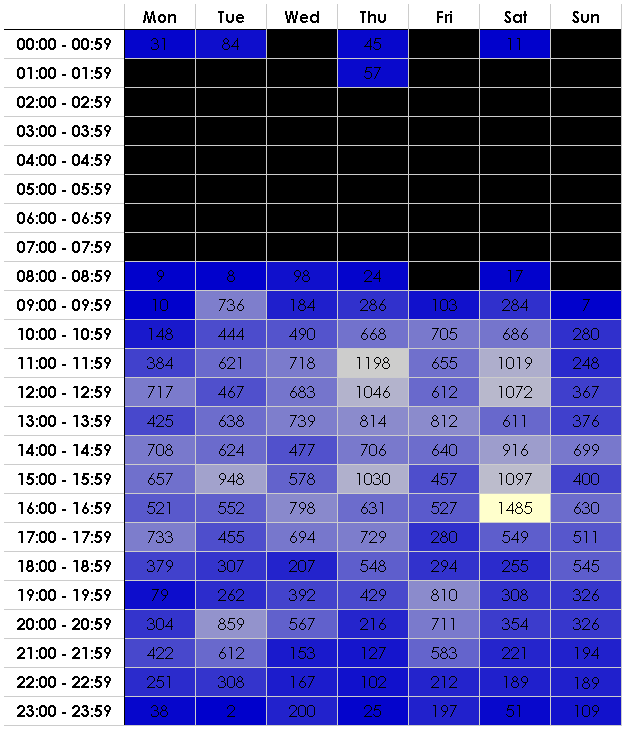
I use a heatmap to show the amount of websites visited for each day of the week and for each hour. This may be useful in showing basic patterns of usage, i.e. you can instantly determine when the user gets up and goes to bed and even when they take lunch/dinner from the smaller values in the heatmap. The heatmap for my internet usage for January – June is below. I have chosen to display 0 values as black, and the rest ranging from dark blue (low values) to cream (high values). From the heatmap you can see I rarely go on the internet before 9am or after midnight. I go on the internet far less on Sundays than any other day and the most on Saturday afternoons. Whilst the heatmap does not convey an awful lot of information, it gives a general idea of web usage and the sorts of figures you will deal with later.
On the server side I hold all the web data in an Sqlite database in a table called Entry and use SQLAlchemy as my object-relational manager.The code to generate the heatmap data is below:
@staticmethod
def generateHeatMap():
"""
    Returns headers for the heatmap, a heatmap and the highest and lowest heatmap values.
    The heatmap consists of (title, [list of values]) tuples.
"""
    headers = ['Mon', 'Tue','Wed','Thu','Fri','Sat','Sun'] # headers for the heatmap

    rows = []   # the heatmap values
    step = 1    # go up by 1 hour at a time

    init = datetime(1, 1, 1)    # initialise at 00:00:00

    start_time = init.time()
    until_time = None

    highest = 0 # need the highest and lowest values to create the scale
    lowest = 0  # to colour each value to

    while(start_time < t((24-step),0,0)): # while the start time is less than the next day
        start_time = init.time()
        # until_time is + step hours - 1 millisecond
        until_time = (init + timedelta(hours=step) - timedelta(milliseconds=1)).time()

        # the heading for each row on the left hand side of the heatmap
        title = start_time.strftime('%H:%M - ') + until_time.strftime('%H:%M')

        values = []
        # monday = 0, tuesday = 1 etc
        for weekday in range(0,7):
            # querying the Entry object which stores web history data.
            # filter by the day of the week and in between start_time
            # and until_time
            q = session.query(Entry)\
                .filter("strftime('%w', access_date) = :dow").params(dow=str(weekday))\
                .filter(Entry.access_time >= start_time)\
                .filter(Entry.access_time <= until_time).count()

            if q > highest:
                highest = q # set highest
            if q < lowest:
                lowest = q  # set lowest

            values.append(q)

        rows.append((title, values))
        init = init + timedelta(hours=step) # reset init to + step hours

    return headers, rows, highest, lowest
In Mako, a Python templating language, it is very easy to generate the heatmap HTML table:
<table id="heat_map_table">
    <tr class="toprow">
        <th id="top_corner"></th>
        % for header in heatmap_headers:
        <th>${header|h}</th>
        % endfor
    </tr>
    % for heading, columns in heatmap_rows:
        <tr>
            <th class="leftrow">${heading|h}</th>
            % for col in columns:
            <td>${col|h}</td>
            % endfor
        </tr>
    % endfor
</table>
The final bit incorporates jQuery and Mako. This colours each cell background in the table with a scaled colour. If the value is zero, then the background colour is black. You can play about with the values in the last line to generate any colour scheme you like. This generates blue to cream (low to high).
var low = ${low|h} - ${low|h};
var high = ${high|h} - ${low|h};
var current = 0, percent = 0, hex = 0;
$('#heat_map_table td').each(function(i){
    current = parseFloat($(this).html()) - low;
    percent = current/high;
    hex = Math.floor(255 * percent);

    if (current == 0){
        $(this).css({backgroundColor: 'black'});
    }
    else{
        $(this).css({backgroundColor: 'rgb('+hex+','+hex+',204)'});
    }
});
